PSA. total
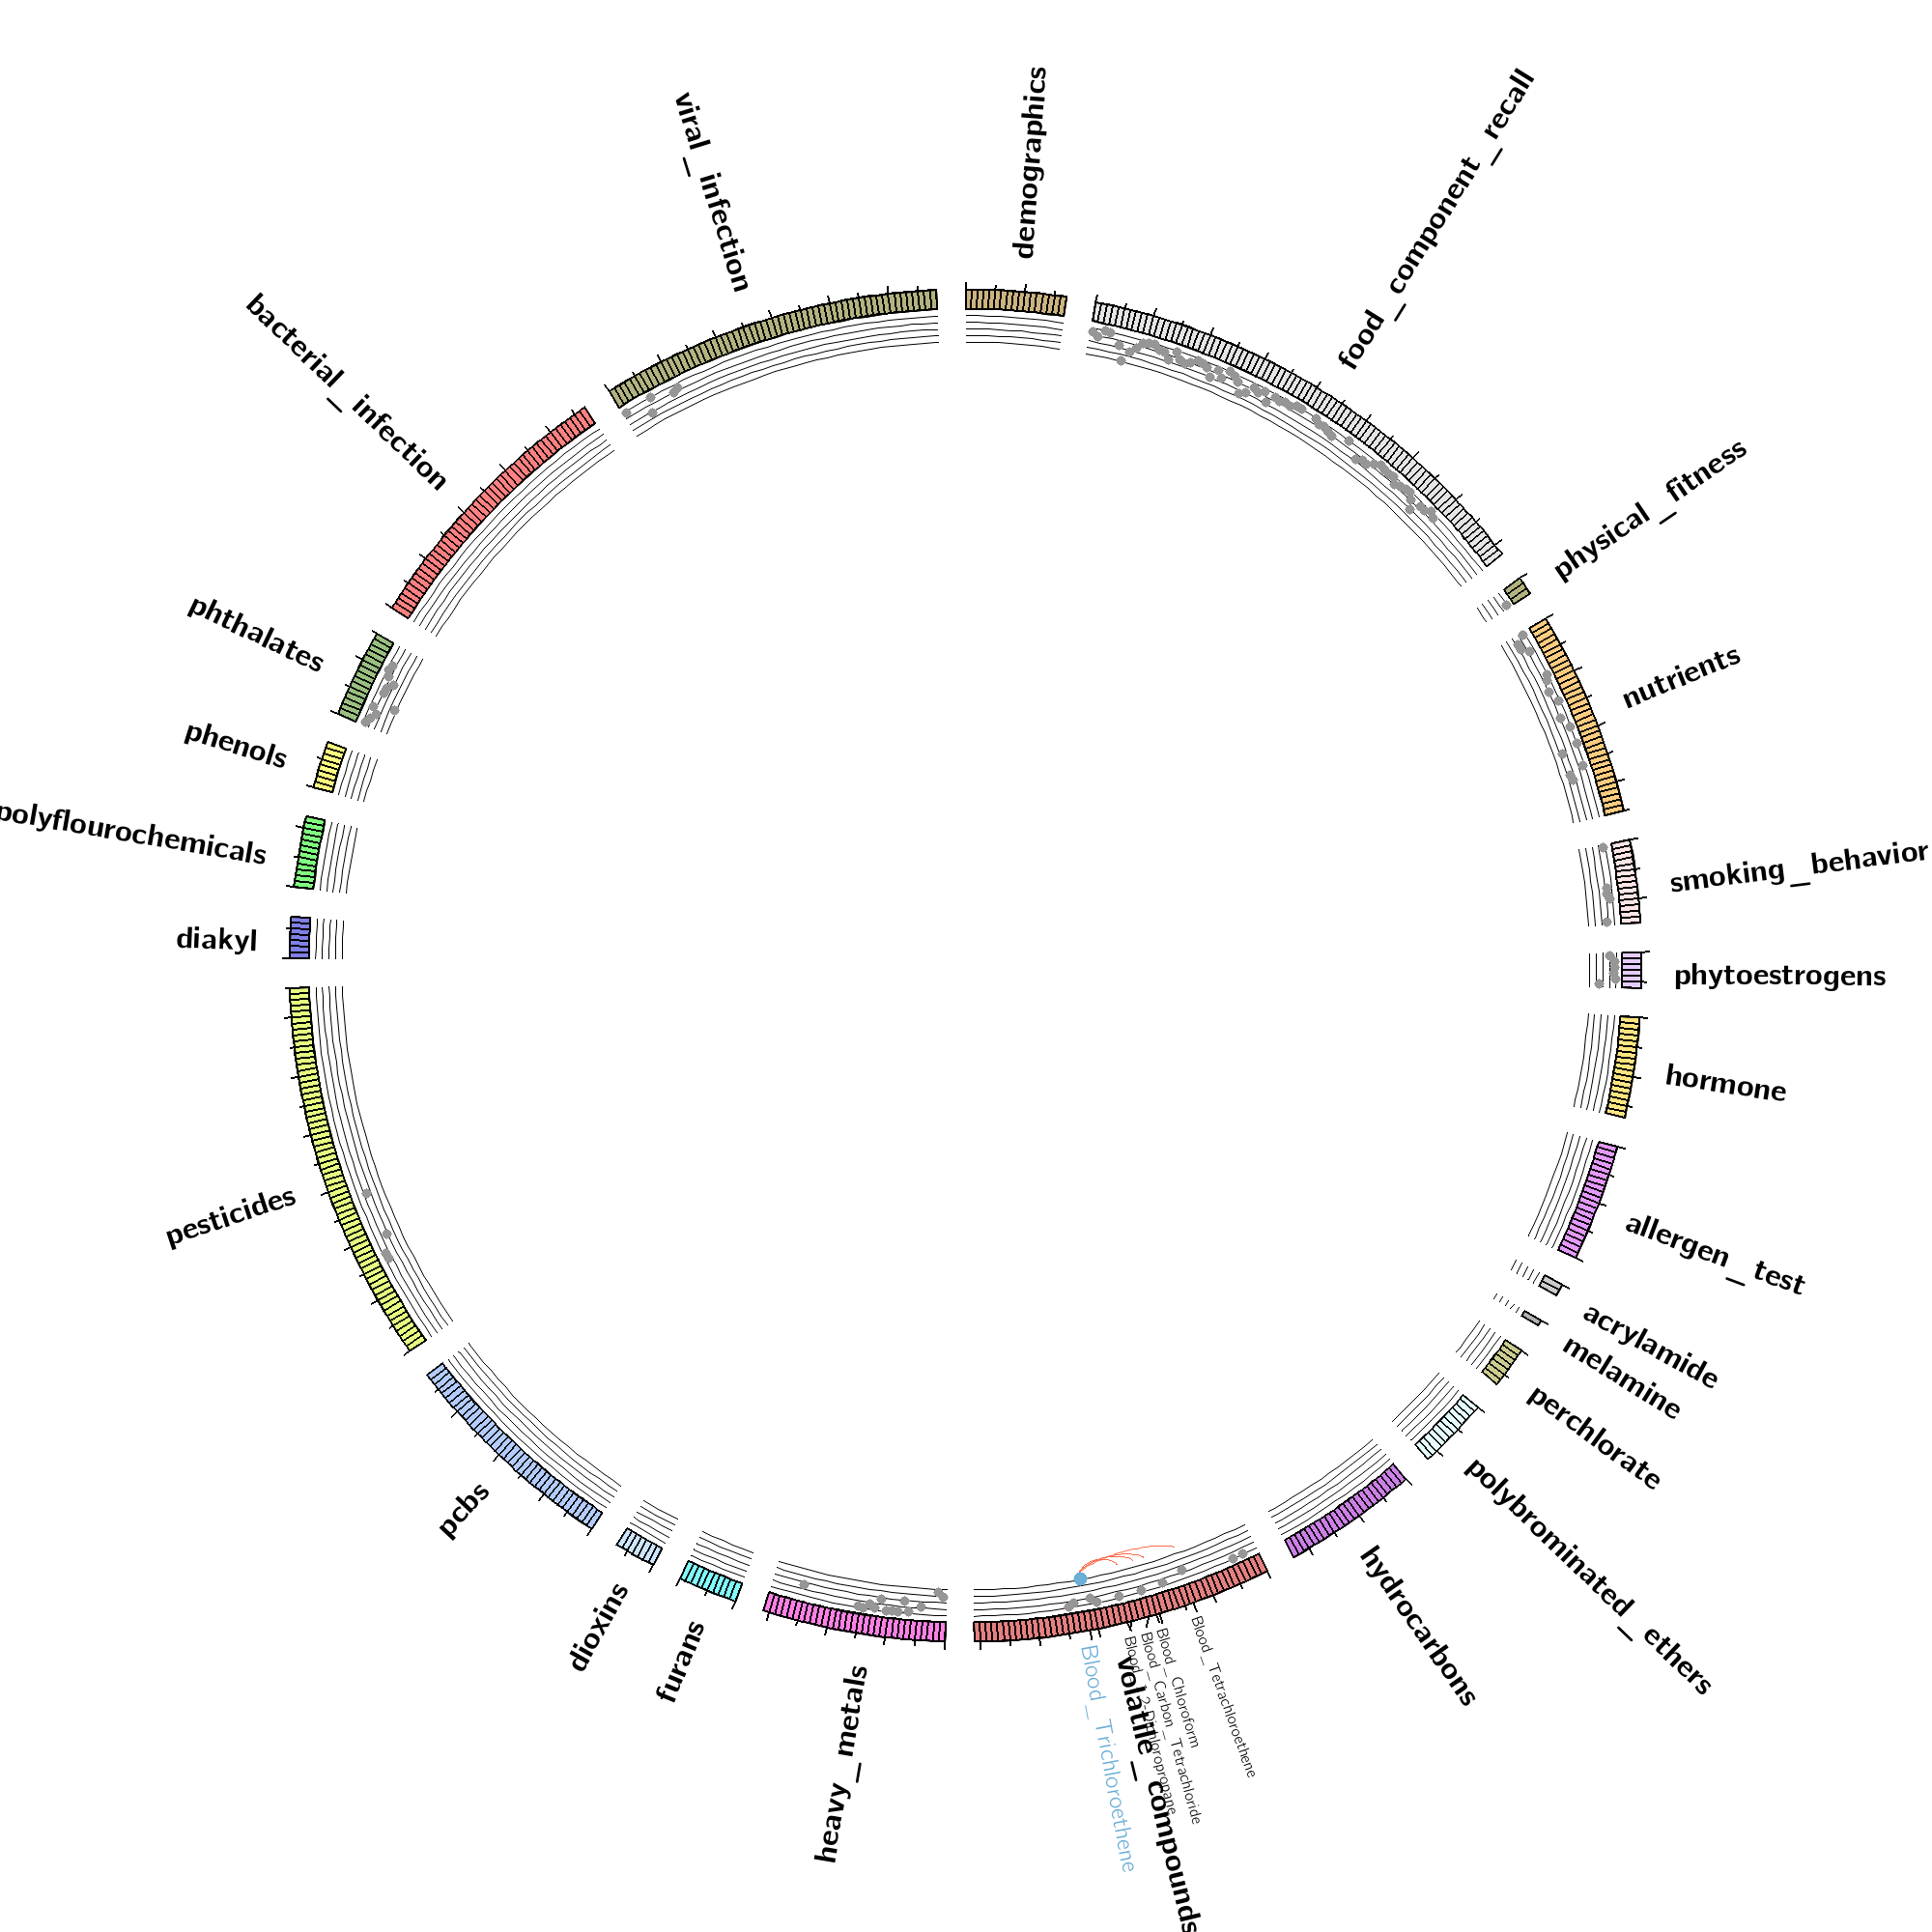
Association -log10(p-values) from EWAS are shown as a separate track above each exposure (red points denote EWAS-replicated associations with positive association size and blue points indicate an EWAS-replicated negative association size). Replicated EWAS associations for PSA. total are offset in labeled in red or blue text. Only "first-degree" correlations (correlations for validated EWAS findings) are displayed in the globes and displayed in black text.
Go Back