Phenotype-Exposome Correlation Globe Browser
blood
Ferritin
Hematocrit
Hemoglobin
Iron, refigerated
MCHC
Mean cell hemoglobin
Mean cell volume
Mean platelet volume
Platelet count SI
Protoporphyrin
Red blood cell count
Red cell distribution width
Segmented neutrophils percent
TIBC, Frozen Serum
Transferrin saturation
blood pressure
60 sec HR
60 sec. pulse:
mean diastolic
mean systolic
body measures
Body Mass Index
Head BMD
Head Circumference
Lumber Pelvis BMD
Lumber Spine BMD
Maximal Calf Circumference

Recumbent Length
Standing Height
Subscapular Skinfold
Thigh Circumference
Total BMD
Total Fat
Total Lean excl BMC
Triceps Skinfold
Trunk Fat
Trunk Lean excl BMC
Upper Leg Length
Waist Circumference
Weight
bone
Bone alkaline phosphotase
cancer
Prostate specific antigen ratio
PSA. total
immunological
Basophils number
C-reactive protein
Eosinophils number
Eosinophils percent
Lymphocyte number

Lymphocyte percent
Monocyte number
Monocyte percent
Segmented neutrophils number
White blood cell count
kidney
1/Creatinine
Albumin, urine
Bicarbonate
Blood urea nitrogen
Chloride
Creatinine
Creatinine, urine
Osmolality
Phosphorus
Potassium
Sodium
Total calcium
Uric acid
liver
Alanine aminotransferase ALT
Albumin
Alkaline phosphotase
Aspartate aminotransferase AST
Gamma glutamyl transferase
Globulin
Lactate dehydrogenase LDH
Total bilirubin
Total protein
metabolic
C-peptide: SI
Cholesterol
Direct HDL-Cholesterol
Glucose, plasma
Glucose, serum
Glycohemoglobin
Homocysteine
Insulin
LDL-cholesterol
Total Cholesterol
Triglyceride
Triglycerides
nutrition
Methylmalonic acid
disease-related outcomes
all-cause mortality (time to death)
Moms with preterm birth
type 2 diabetes (fasting blood glucose >= 125 mg/dL)
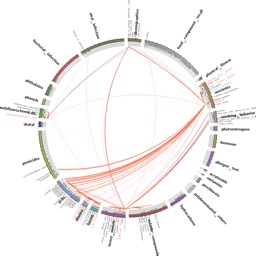
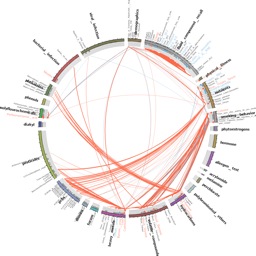
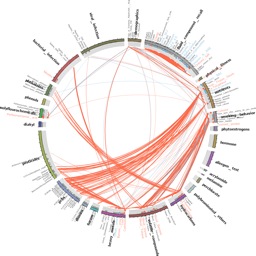
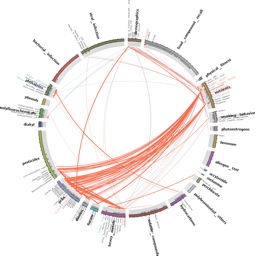
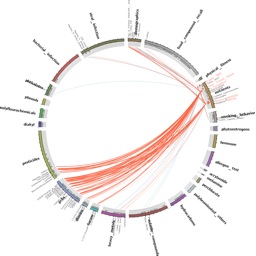
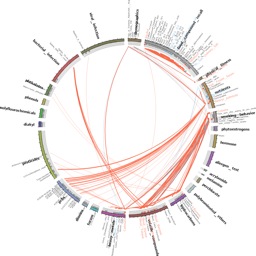
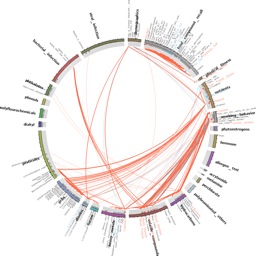
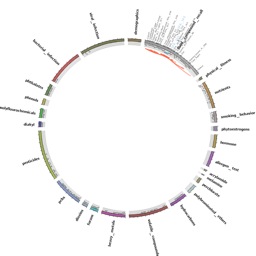
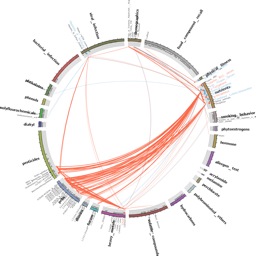
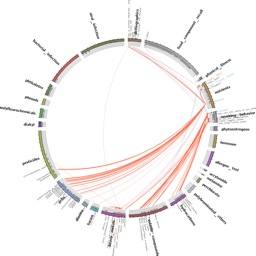
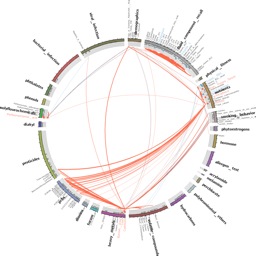
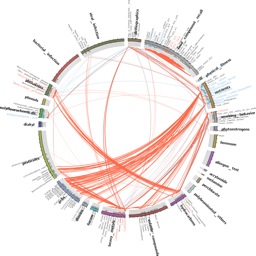
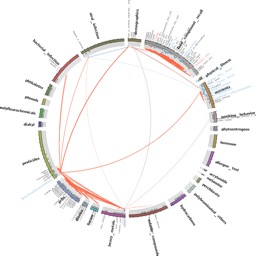
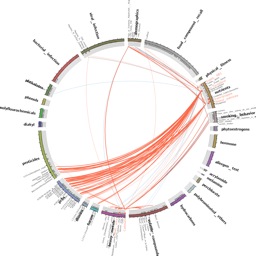
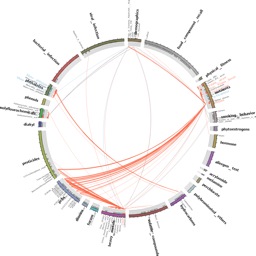
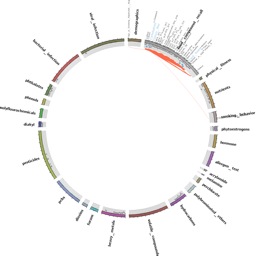
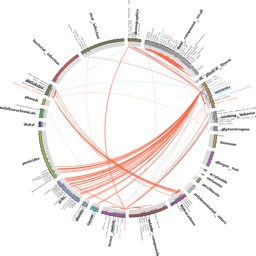
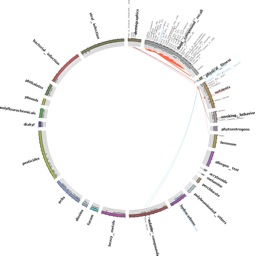
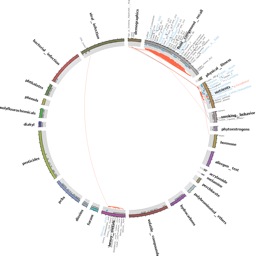
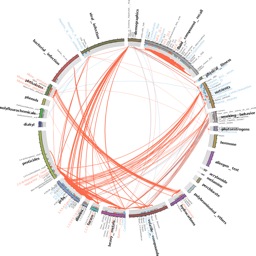
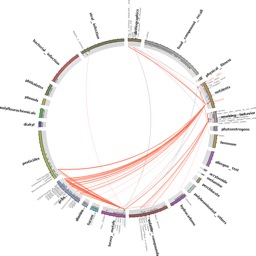
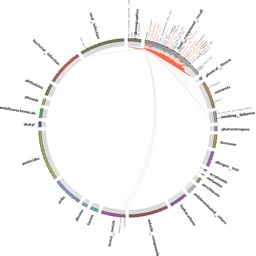
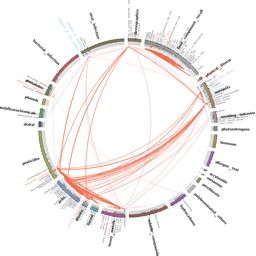
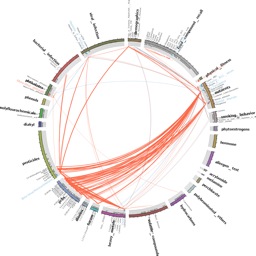
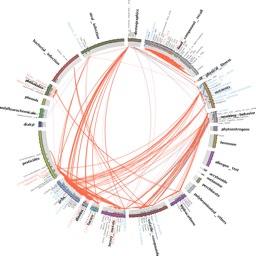
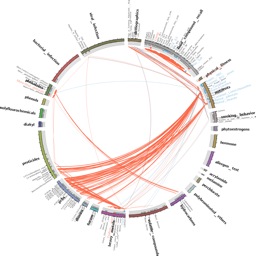
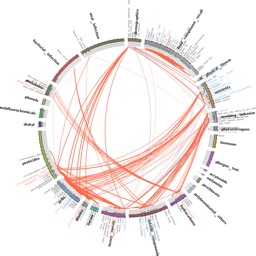
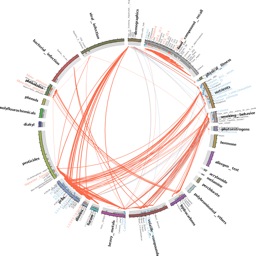
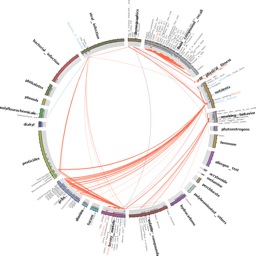
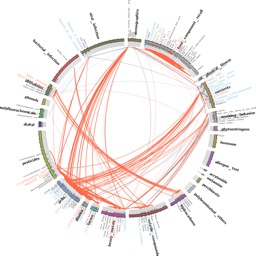
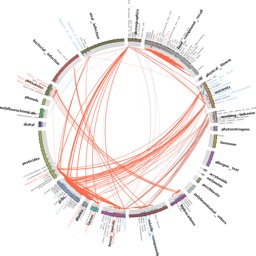
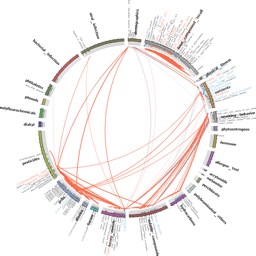
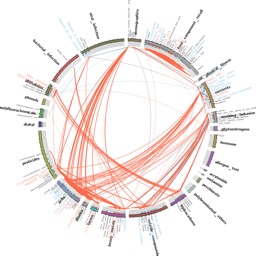
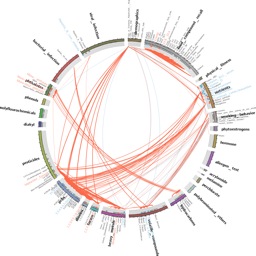
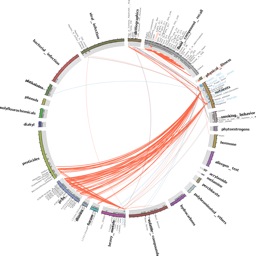
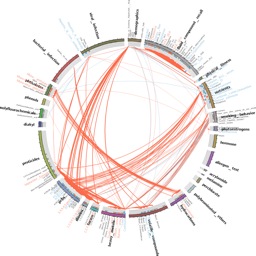
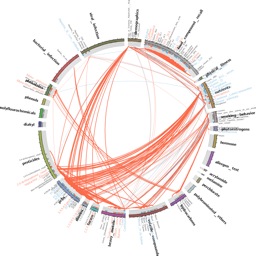
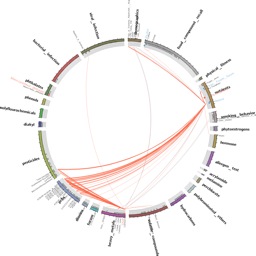
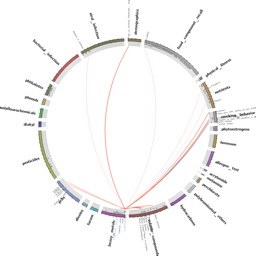
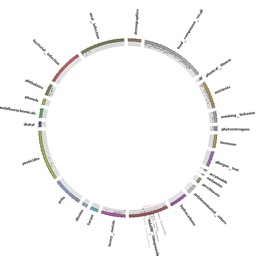
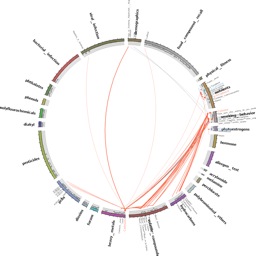
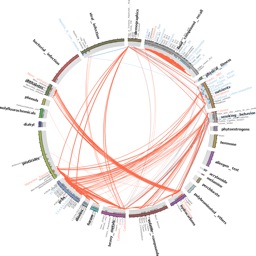
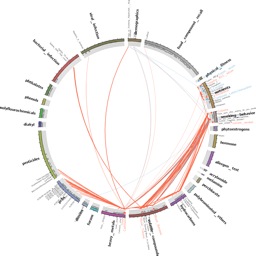
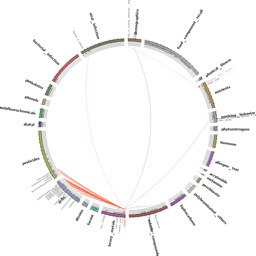
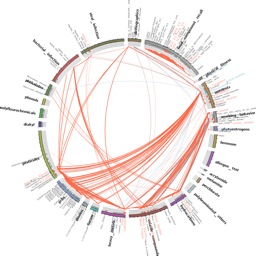
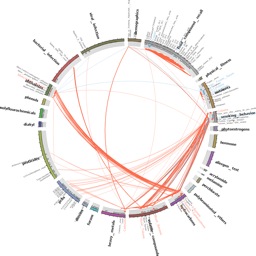
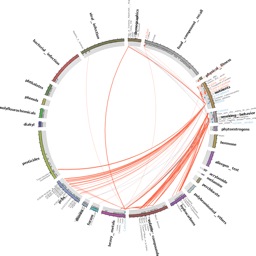
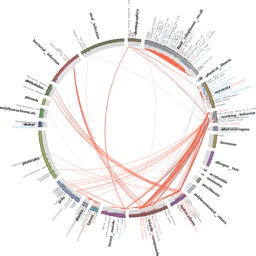
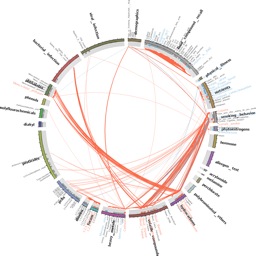
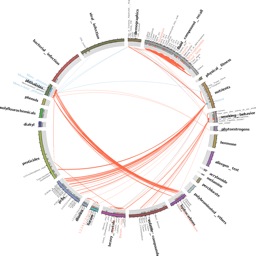
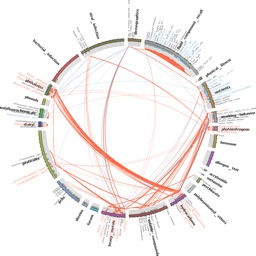
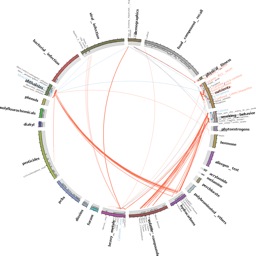
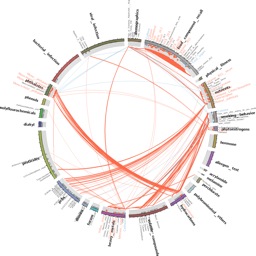
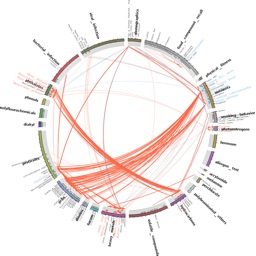
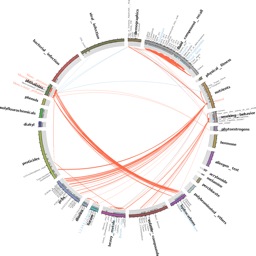
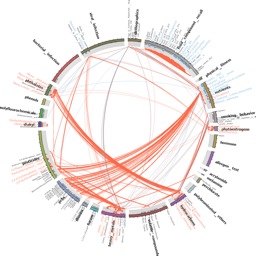
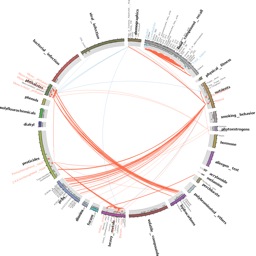
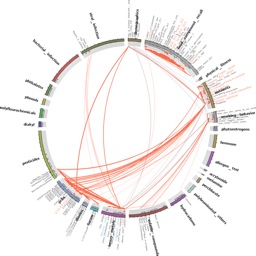
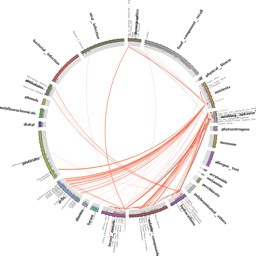
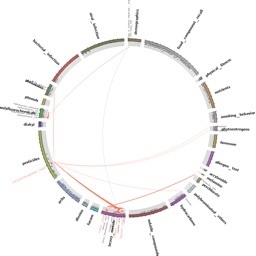
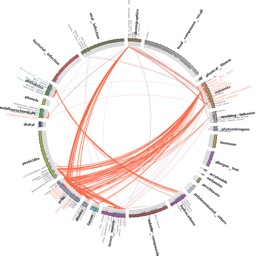
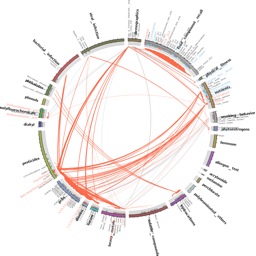
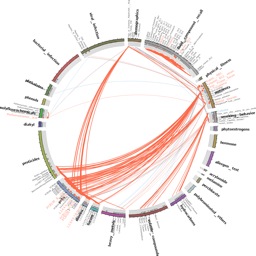
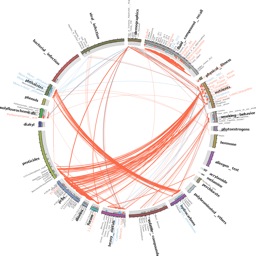
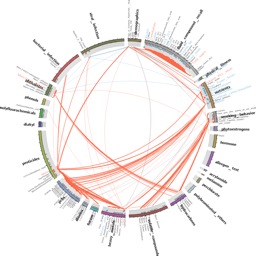
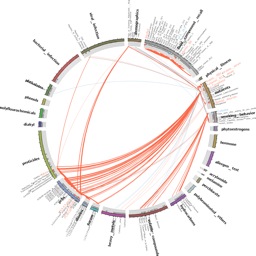
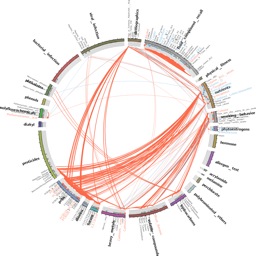
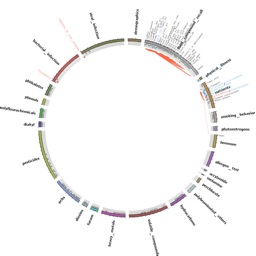
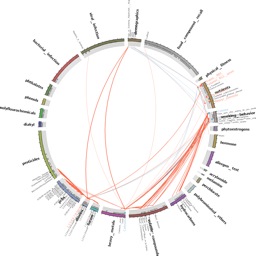
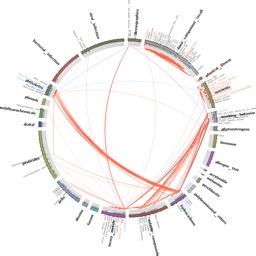
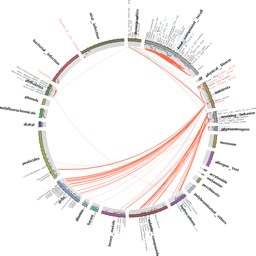
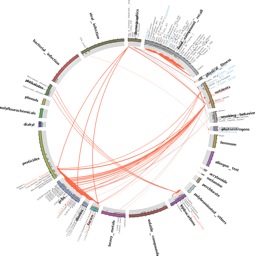
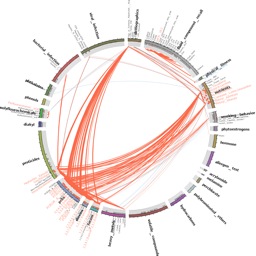
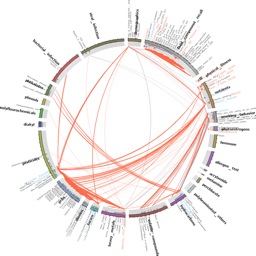
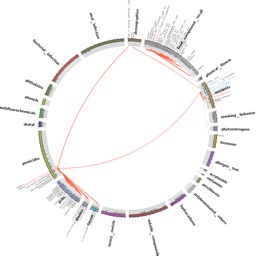
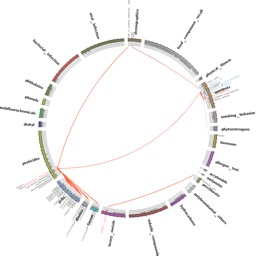
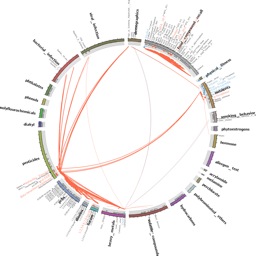
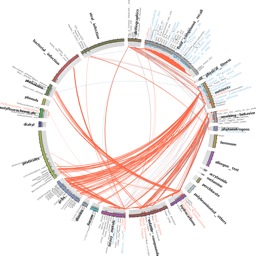
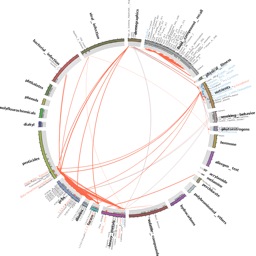
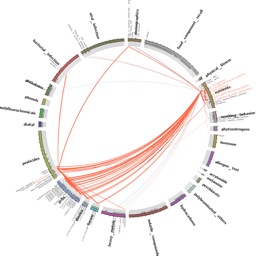
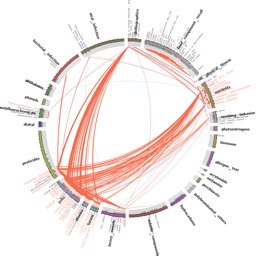
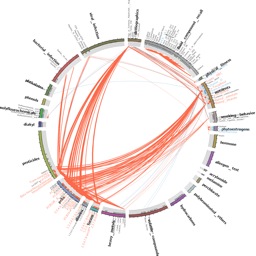
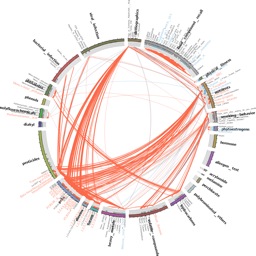
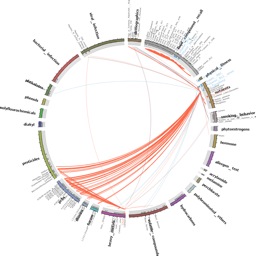
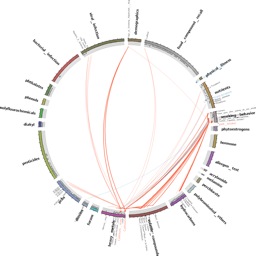
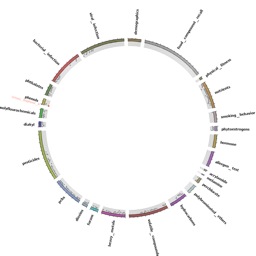
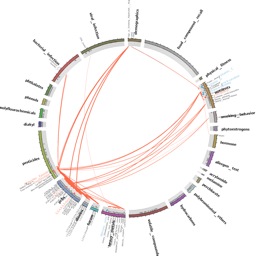
About the globes
The exposome correlation globes above display the correlation between pairs of environmental exposures where at least one of the exposures is associated with a clinical phenotype. Globes are arranged in order of category of clinical phenotype (e.g., body measure parameters, cancer diagnostics, etc.).Click on them for greater detail.
Brought to you by chiragjpgroup.org; globes created with Circos software and code on GitHub.